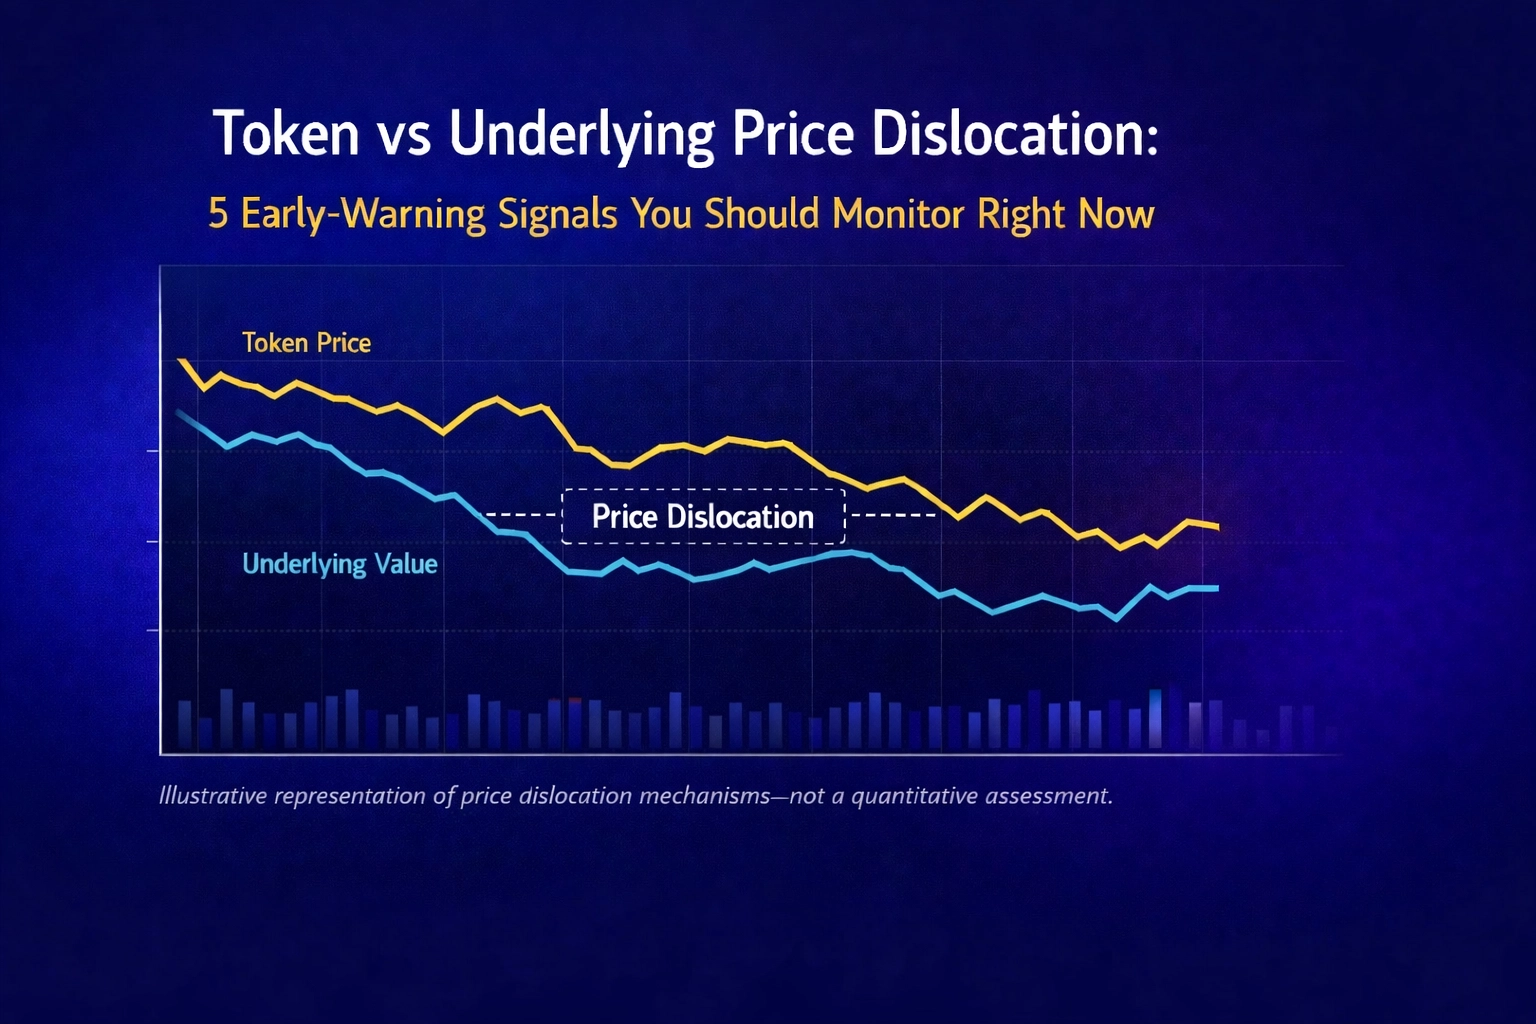
Price divergence between tokenized assets and their underlying securities is not a binary event. It emerges through observable, measurable distortions in market structure that typically precede material tracking error. Risk teams evaluating tokenized real-world assets: particularly tokenized treasuries, money market instruments, and credit products: require systematic monitoring frameworks that identify stress before it crystallizes into portfolio impact.
The following five signals represent quantifiable early-warning indicators drawn from observed dislocations across tokenized RWA markets. Each signal reflects a structural friction point where on-chain settlement mechanics diverge from traditional market operations.
1. Redemption Latency Expansion (Time-to-NAV)
Redemption mechanisms anchor token prices to underlying net asset value. When the time required to convert tokens back to underlying assets lengthens beyond contractual expectations, premium and discount bands widen accordingly.
What to monitor: Track the elapsed time between redemption request submission and settlement of underlying cash or securities. Compare realized redemption windows against stated terms in offering documents. A three-day redemption window expanding to five or seven days signals operational stress or custodian capacity constraints.
Why it matters: Redemption latency directly determines arbitrage efficiency. When authorized participants cannot reliably close basis trades within predictable timeframes, they withdraw liquidity from secondary markets. The result is wider bid-ask spreads and greater price volatility independent of underlying asset behavior.
Systematic tracking requires logging redemption requests across wallet addresses and mapping settlement timestamps. Deviation from historical distributions: particularly during periods of elevated redemption volume: indicates degraded price anchoring capacity.

2. Secondary Market Liquidity Fragmentation (Cross-Venue Spread)
Tokenized assets frequently trade across multiple venues: decentralized exchanges, centralized crypto exchanges, and OTC desks. Unlike consolidated order books in traditional markets, liquidity fragmentation creates persistent price discrepancies that widen under stress.
What to monitor: Calculate the standard deviation of token prices across all active trading venues on an hourly basis. Establish baseline spread distributions during normal market conditions. Alert thresholds trigger when cross-venue spreads exceed two standard deviations from the 30-day mean.
Why it matters: Fragmented liquidity reflects market structure inefficiency that exacerbates during volatility. When a token trades at $99.80 on Uniswap, $100.05 on a centralized exchange, and $99.95 OTC simultaneously, arbitrageurs face execution risk that prevents convergence. If spreads persist or widen, it signals deteriorating price discovery and heightened tracking error risk.
This monitoring requires real-time data feeds from all venues where the token maintains material volume. Historical spread data establishes baseline behavior; deviations indicate structural stress.
3. Holder Concentration and Wallet Rotation
On-chain transparency allows direct observation of token holder distribution. Rapid concentration increases or unusual wallet rotation patterns often precede liquidity events that disrupt pricing.
What to monitor: Track the percentage of total supply held by the top 10, 25, and 100 wallet addresses. Calculate wallet turnover velocity: the rate at which tokens move between unique addresses. Sudden spikes in either metric warrant attention.
Why it matters: Concentrated holdings create liquidation risk. If three wallets control 40% of circulating supply, a single holder's exit can overwhelm available liquidity and trigger temporary dislocations. High wallet rotation may indicate speculative activity displacing natural holders, reducing the stability of the holder base.
Institutional monitoring systems typically flag concentration ratios above 30% for the top 10 holders, or wallet turnover exceeding 15% weekly. These thresholds vary by asset class and market maturity but provide starting points for alert calibration.

4. Oracle Update Frequency & Latency (Temporal Mismatch)
Many tokenized RWAs rely on oracle systems to publish updated NAV figures, particularly for assets without continuous public pricing (private credit, real estate, certain fixed-income structures). Oracle update patterns create temporal mismatches between on-chain prices and underlying valuations.
What to monitor: Log oracle update timestamps and calculate time intervals between updates. Measure latency between underlying market close and oracle publication. Establish expected update cadences and flag deviations.
Why it matters: If an oracle updates NAV once daily but the token trades 24/7, intraday price movements reflect speculation rather than fundamental value changes. Extended oracle latency: a daily update delayed by six hours: creates information asymmetry that sophisticated participants exploit, driving short-term dislocations.
During periods when underlying markets experience volatility but oracles remain stale, token prices may continue trading at outdated levels. This temporal mismatch amplifies tracking error and creates false signals for automated trading systems.
5. Implied Yield Divergence from Benchmark
For income-generating tokenized assets, the implied yield derived from token price should track the benchmark yield of the underlying instrument within a predictable corridor. Divergence beyond historical norms signals market stress or structural friction.
What to monitor: Calculate implied yield daily: (expected distributions / token price) × (365 / distribution period). Compare against the benchmark yield for the underlying asset class (e.g., 3-month Treasury yield for tokenized T-bills). Track the spread between implied and benchmark yields over rolling 30-day and 90-day windows.
Why it matters: Yield divergence isolates the tokenization premium or discount from fundamental moves in underlying rates. A tokenized treasury yielding 50 basis points below equivalent direct T-bill exposure indicates persistent market friction: potentially driven by redemption constraints, liquidity concerns, or counterparty risk perception.
Sustained yield divergence exceeding 25-30 basis points typically reflects structural issues rather than temporary arbitrage inefficiency. Risk teams should investigate custody arrangements, redemption mechanics, and secondary market depth when divergence persists across multiple observation periods.

Implementation Considerations
Effective monitoring requires establishing baseline distributions for each signal under normal market conditions. Alert thresholds should be calibrated to asset-specific characteristics: a newer tokenized product with limited history may exhibit greater variability than mature, liquid instruments.
Integration into existing risk frameworks typically involves:
- Daily dashboard updates showing current values and deviations from baseline for all five signals
- Automated alerts when any signal breaches predefined thresholds
- Weekly summaries documenting signal behavior across the portfolio of tokenized exposures
- Escalation protocols defining risk committee notification requirements
None of these signals alone constitutes a portfolio decision trigger. Instead, they function as diagnostic indicators that prompt deeper investigation into specific tokenized positions. Convergence of multiple signals: redemption latency expanding while holder concentration rises and implied yield diverges: warrants immediate portfolio review.
Conclusion
Token versus underlying price dislocation emerges from structural friction points inherent in market design. Systematic monitoring of redemption mechanics, liquidity fragmentation, holder behavior, oracle dependencies, and yield relationships provides risk teams with quantitative early-warning capabilities.
These signals do not predict future dislocations with certainty. They identify deteriorating market structure conditions that increase dislocation probability. For committees evaluating allocations to tokenized real-world assets, implementation of systematic monitoring frameworks represents a necessary evolution from trust-based assessments toward data-driven risk management.